In the fast-paced world of trading, where fortunes can swing wildly, traders aren’t just gamblers; they’re detectives. While the price of an asset is undoubtedly the headline, savvy traders delve deeper. They scrutinize charts, searching for clues like the telltale ‘hammer’ candlestick, a powerful signal of a potential price reversal.
By meticulously analyzing price action, these detectives piece together the story unfolding in the market, anticipating future moves and making informed decisions in the high-stakes game of trading.
Market players can predict and understand the market behavior using evoke sympathy for certain assets type and share candle stick patterns of those assets. Under this category, one can insert the hammer pattern, which is very popular with traders ending in green candles. Then, When one thinks of bullish candlesticks, one of the very well-known patterns is the hammer candlestick formation.
A hammer is one of the more important reversal patterns for traders to learn. The hammer is considered a bullish reversal pattern but only in certain situations. Usually, the pattern develops after prolonged price drops, meaning that the market is trying to establish a certain level.
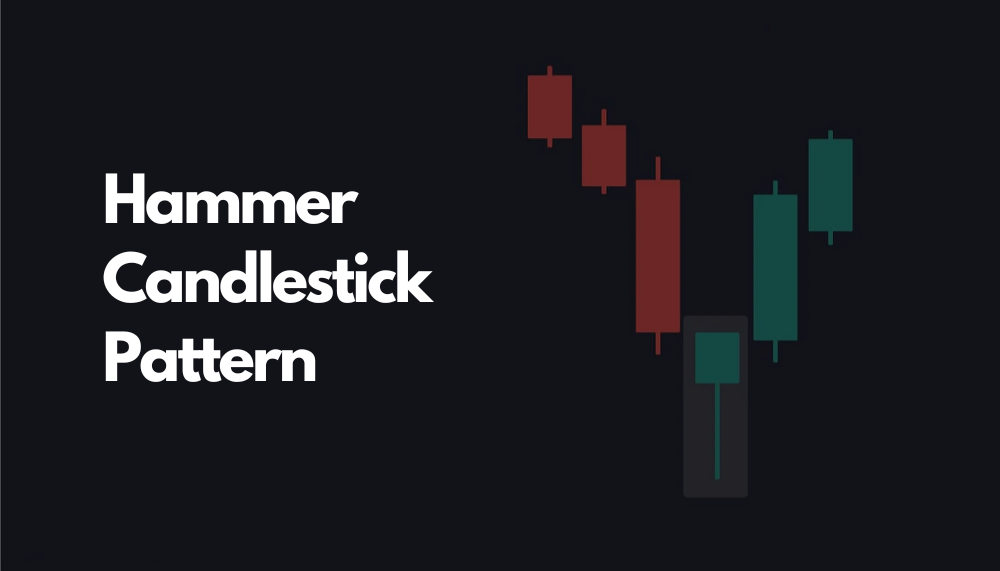
What is Hammer Candlestick?
A hammer candlestick is a pattern that occurs at the end of a downtrend and often has an impending reversal in the market coming soon, as bullish news approaches. This candlestick pattern has a stock open, then moves way down during the day, and rallies back up close to the opening price.
The candlestick pattern resembles a hammer in that the long lower wick from the lows of the day looks much like the handle and the opening and closing price body form what looks like the hammer’s head. A smaller hammer has a lower wick twice that of its candle body, but it can be much larger than this.
A long lower shadow of the Hammer means that the market experimented to find out where support and demand were located. Upon locating the support area, the market found the lows of the day turned back by the bulls, pushing the prices higher near the opening price. Hence, the bearish advance was rejected by the bulls downwards.
Inverted Hammer Candlestick Pattern
The formation of the candlestick pattern known as The Inverted Hammer is usually found within the bottom zone of the price deposits indicating the downward pressure and can provide a hint that position will be taken by an upward reversal.
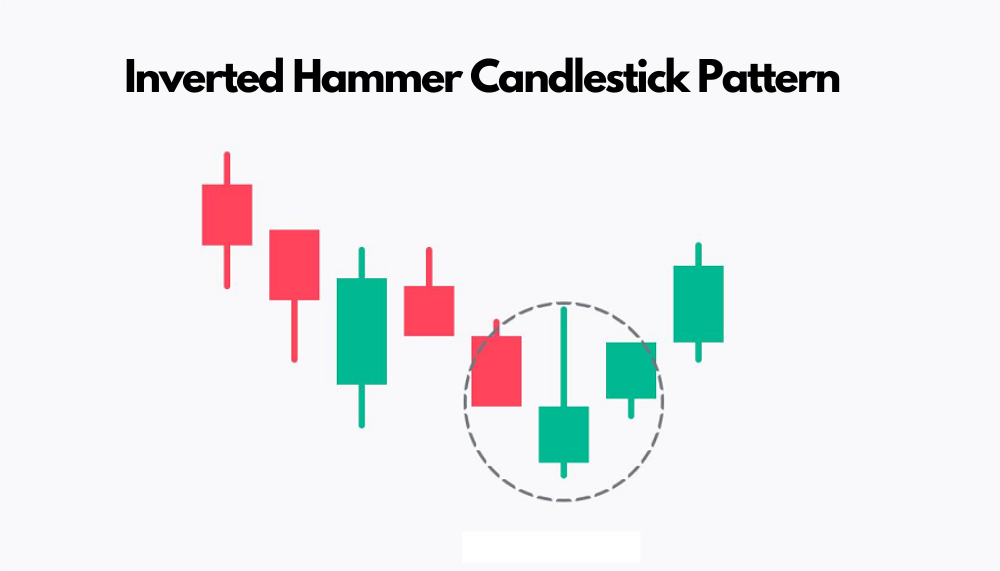
It is worth reminding that The Inverted pattern is very useful in forecasting price movement changes but signals neither the beginning of a trend nor the point to enter into the market.
The inverted hammer pattern, quite similar to the shooting star pattern, is formed when open, low, and close are approximately at the same price level. However, there is a considerably long upper shadow, which should not be less than twice the size of the actual body.
When the open equals the low a more pronounced bullish signal is developed in the form of a bullish inverted hammer candlestick.
After a long pronounced downtrend, a bullish signal is generated by the formation of an Inverted hammer as prices seem to have tired of their downward movement as they surged significantly on that day.
However, at the day’s high, these sellers were unable to hold the stock, futures, or currency down and prices converged back to the opening. But the fact that prices were pulled into oblivion yet on that day, bulls successfully tested and defied the weakness of bears strongly suggests that the battle was between bulls and bears.
Importance of Hammer Candlestick Pattern
The importance of hammer candlesticks is as follows:
- Might function as the primary intraday factor indicating the change of the bullish/bearish trend strength.
- This indicator provides evidence whether implicitly or explicitly, that the price has formed a degree price goes up or down “hammering” a top or bottom in place before closing back to where it opened.
- The importance of a shadow also varies with the length (ideally 2-3 times more than the body), especially on longer time frames.
- Hammers might also be helpful to reinforce, or confirm, other reversal signs.
- A hammer reversal pattern is rendered ineffective when immediately following its formation, a higher peak is made. On the other hand, a hammer bottom gets invalidated if the succeeding candle prints a lower trough.
How to Trade on a Hammer Candlestick?
Generally, the more in the higher time frame a hammer pattern is found, the stronger the reversal signal.
It is like hitting the jackpot when such patterns are spotted on the chart, more so on a daily or weekly chart exterior.
Because of how much difference this pattern makes on the price charts, it is primarily applied in ‘conservative’ strategies.
How to Use Hammer Candlestick Pattern Effectively?
The Hammer Candlestick Pattern, being a widely used tool for technical analysis, helps traders indicate possible price turns during downward movements. It is, however, effortless to use a pattern and expect success unless certain steps are followed.
1. Correctly Identify the Pattern: The first task is to rule out instances where the hammer candlestick pattern has not been made on the price chart. The Hammer Pattern contains a body that is small relative to its long lower shadow that measures about twice or three times the height of the body.
Also, the Hammer Pattern comes into play when a trend is down which is a series of lower highs and lower lows.
2. Wait for Confirmation: Following the spotting of the hammer formation, one should pause for the confirmation of the expected change of trend. This normally is the engulfing candlestick pattern whereby the next candlestick closes higher than the closing price of the Hammer Pattern meaning that the bear trend has been broken.
Many traders prefer to go long by placing a buy order at this point because the confirmation candle often indicates the beginning of an upward movement.
3. Set Stop-Loss and Take-Profit Levels: Managing trading risks is fundamental and a stop-loss order should be set whilst trading. A stop-loss can be placed just below the lowest price of the Hammer Pattern to avoid more losses. If that level is penetrated, it means that the downtrend is more likely to continue.
The Hammer Pattern does not provide price directional clues so other indicators or resistance levels need to be used to ascertain profitable exits.
4. Monitor and Adjust: A trader should also be vigilant in monitoring the price action after the trade has been executed. If the price is favourable, then ready the position for closure at the stop-loss level set to avoid incurring a loss.
Difference Between: Hammer Candlestick vs. Doji
A Doji is another type of candlestick that also has a proportionally small body. It represents indecision within the market due to the presence of upper and lower shadows. Dojis may indicate either a price reversal or a continuation of the prevailing trend, depending on the confirmation that comes after.
This is not to be confused with a hammer that comes in after a price reduction and indicates a possible change in the price trend in an upward direction provided there is another confirmation and has only a lower long shadow.
Limitations of Hammer Candlestick
Utilizing the Hammer-Inverted Hammer configuration to enter a trade always necessitates the following considerations first:
- Establish whether there exists a support line at the bullish hammer and inverted hammer formations and a resistance line at the shooting star and hanging man formations;
- It is not a prerequisite, but clear space needs to be observed between the said patterns and the immediately preceding or succeeding candles;
- Seek confirmation of trend reversal using not only these patterns but also other technical indicators or candlestick formations.
- Observe the volume of trades to assess the strength of the particular trend.
Failure to adhere to these, you risk undue exposure in the market without any possible relief.
FAQs
Q1. Is a Hammer always bullish?
Ans. The aforesaid patterns are known as Hammer and Inverted Hammer respectively. They are always bullish because they are normally found in a plotted downtrend. However, the picture changes when Hammers appear in an already established uptrend.
In this case, we will refer to them as Hanging Man, which is not a good sign for the bulls and Shooting star, again a picture of a trend reversal for the bulls in the making.
Q2. Is Inverted Hammer reliable?
Ans. One of the more prominent chart patterns is the Inverted Hammer. Nevertheless, it is possible to assert that no method can forecast future price movements with total precision.
In employing Hammer and Inverted Hammer candlesticks within one’s trading methods, do remember to incorporate additional views and safeguard instruments to reduce possible risk exposure.
Q3. Does it matter if a hammer is red or green?
Ans. Regardless of their colour, all Hammer and Inverted Hammer patterns are believed to be bullish reversal patterns. Still, green hammers are more reliable trading signals as they imply that the bulls dominated the bears during the candle period.
Conclusion
In conclusion, the hammer candlestick formation is a reversal indicator, mostly used to predict bullish trends, which come after a prolonged downtrend. However, it is crucial to keep in mind that every pattern has its limitations so traders should always analyze the market more widely and employ other indicators to verify the signal.
By being aware of the factors involved in the hammer candlestick pattern and applying them efficiently, traders can be able to improve their trading strategies and thus the odds of winning.