Analysts rely on trendlines in forex as crucial tools for their technical analysis. These traders prioritize recognizing market trends over fundamental factors such as past business performance or current news. One effective method they use to achieve this is by accurately drawing trend lines on price charts.
When it comes to recognizing patterns, trendline trading stands out as the most effective method.
You may ask, “Why is recognizing trends so important?” Let’s explore that.
Technical analysts assert that pinpointing the trend is the initial step toward grasping market sentiment and executing successful trades. We’ll delve deeper into this shortly.
In the forex market, trendlines offer clear signals for making long or short trades. They enable traders to easily determine whether a trend is likely to persist or reverse. In this article, we will explore everything related to trendlines in forex trading.
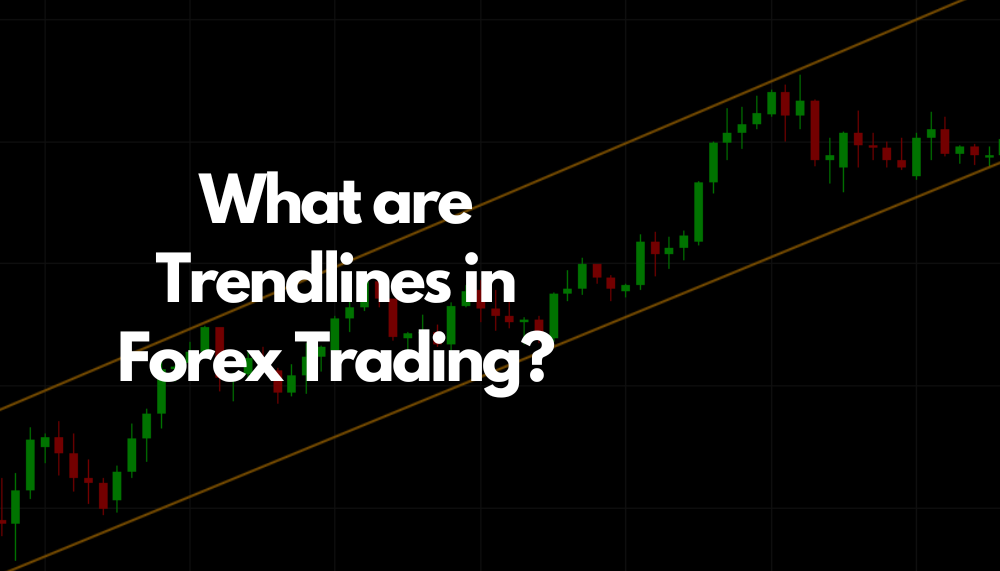
What is Trendline in Forex?
A line placed simply on a price chart is a trendline. When prices are going up, this line connects the lowest price points. When prices are going down, it connects the highest price points. Using trendlines in forex helps traders decide the best times to buy or sell by showing levels where prices might stop going higher or lower.
These lines are useful for understanding the general direction of market trends by showing how prices are changing over time. Forex trendlines can assist traders in predicting future values of currency pairs.
Example of a Trendline
Imagine you’re thinking about trading the USD/EUR currency pair. The price chart shows a line moving upwards. It begins at 1 on a certain trading day, reaches a high of 2.5 in the middle of the day, and ends at 2.2. When the line moves up, the starting point at 1 acts as a support level.
Here, prices usually stop dropping and start going up again. At this stage, you can consider buying more USD/EUR because the prices are on the rise. The upward trendline starts from the first notable price of 1.5 and keeps going up.
It links high price points like 2.2 and 2.5, and then comes down slightly to end at 2.2. This pattern indicates that the USD/EUR market is generally on an upward path.
What Are Uptrend and Downtrend?
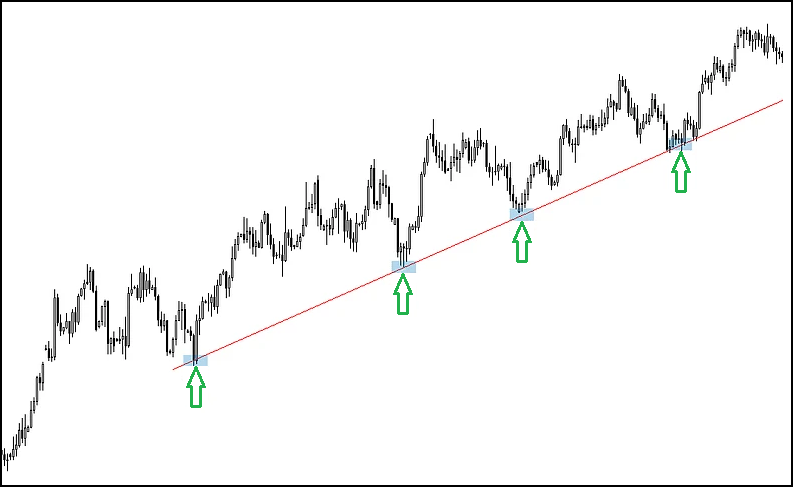
An upward trend line, marked by a positive slope, connects several low points. This positive slope is validated when the second low exceeds the first. Such bullish trendlines indicate that the market prices of an asset are increasing and are anticipated to keep rising as long as the forex trendline remains valid.
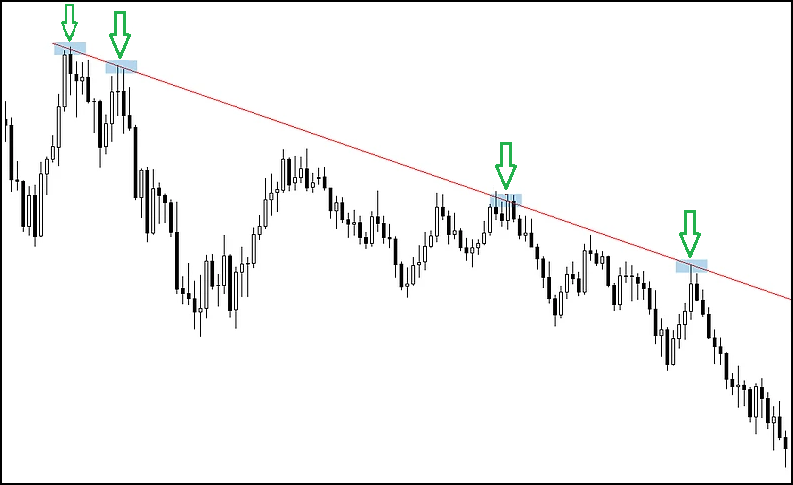
A downtrend line is determined by connecting two or more high points of a currency pair, resulting in a negative slope. To sustain a negative slope, the second high point must be lower than the first. Unlike uptrends, these bearish trendlines suggest that the prices of a financial instrument are declining and are expected to continue to do so as long as the trendline is intact.
What do Trendlines Tell You?
A trendline provides insight into the current price movements of a currency pair within the forex market. It visually illustrates the support and resistance levels of the currency pair, indicating whether the market is likely to maintain its trajectory or reverse. By analyzing the trendline’s orientation, traders can execute long or short orders to capitalize on upward or downward market trends.
Additionally, a trendline reflects the rate of price changes in conjunction with its direction. A trendline with many price changes and a zig-zag shape shows quick price shifts, indicating a volatile market. Conversely, a trendline that is more uniform with fewer fluctuations suggests slower price movements, indicative of a less volatile market.
What are Trendline Channels?
A trendline channel consists of multiple parallel trendlines that help in identifying the prevailing market trend as well as potential buy and sell signals. One trendline is formed by connecting the market’s high price points, while the other connects the market’s low price points.
When the prices of a currency pair fluctuate between these two parallel trendlines, it is referred to as moving within the trendline channels. These channels can provide insights into whether the market is currently experiencing an upward or downward trend.
- In a rising market, trendlines are placed below the currency pair’s price movements, while the trend channel line is above the peak price levels, showing that the upward trend is likely to continue.
- In a market characterized by a bearish trend, trendlines are positioned above the currency pair’s price movements, while the trend channel line is positioned below the lowest price points, suggesting a continuation of the downward trend.
In a rising market, the trendline serves as a support line and can indicate a good time to enter. In contrast, during a bearish trend, the trendline functions as a resistance line, providing an exit signal.
- In a bullish situation, use an upward trendline to enter a trade. Set stop-loss orders below this line to minimize losses, and place take-profit orders at the other trendline.
- For exiting or shorting a trade in a bearish scenario, employ a downward-sloping trendline and position stop-loss orders above it to minimize losses, with take-profit orders set at the opposite trendline.
How to Draw Trendlines in Technical Analysis
To accurately draw trendlines in technical analysis, you need to find at least two high or low price points that match upward or downward trends. In a downtrend, once you have identified the swing highs, you should draw a trendline beneath the market price to establish the trendline in forex.
Conversely, in an uptrend, after identifying the swing lows, you will draw a trendline above the market price.
The validity of the trend is further reinforced when the market price interacts with the trendline, indicating that a growing number of traders are utilizing these lines as support and resistance levels. Below are six straightforward steps to draw a trendline:
- Access the trading chart for the currency pair and use the drawing tool to create trendlines.
- Incorporate the trendlines and highlight the support and resistance levels, along with other buy and sell signals, for a clearer understanding of market behavior.
- Examine the price chart to understand the market trend.
- If the trend is upward, make a buy order, and create a sell order in case it is downward.
- After executing the trade, establish your stop loss and take profit orders based on the trendlines you have drawn on the chart to mitigate trading risks and enhance potential profits.
Tips for Trendline Trading
Always try to link three swing highs or lows to create a valid forex trendline. However, it is advisable to connect as many swing highs or lows as possible, as a higher number of points enhances the accuracy of trendline analysis.
By linking multiple swing highs or lows to create a trendline, its validity is maintained over the long term. By properly linking swing lows to other swing lows and swing highs to other swing highs, you can create a trendline channel that prevents any candlestick on the chart from crossing the trendline.
Bearish trendlines signify a continuation of a downtrend in the market, providing optimal signals for shorting or selling in a bearish environment. This is due to the expectation that prices will decline further, making long positions potentially unprofitable.
Conversely, bullish trendlines indicate a continuation of an uptrend, offering ideal signals for going long or buying in a bullish market. This occurs because prices are anticipated to rise further, and entering short positions could lead to losses. By following trendlines that match the market direction, you can make the most of their potential.
Top Trendline Indicators
Trendline indicators are valuable tools for understanding market trends. A popular platform for using these tools is MetaTrader 4 (MT4). On the MT4 website, you can download extra trendline indicators and adjust them to fit your trading style.
1. Simple Moving Average (SMA)
Simple Moving Average shows the currency pair’s average price over a certain period. It gathers prices over time, splits them into different periods, and smooths out irregularities to reveal a clear trend. The SMA appears as a flat line. When the current market price is close to this line, it suggests the trend will likely continue. If the market price moves away from the line, it might indicate a change in the trend direction.
2. Stochastic Oscillator
This aids in recognizing market trends and reversals. It uses two lines, %k and %d, for analysis.
- The %k line compares the highest and lowest prices of a currency pair to determine the range it is currently trading within.
- The %d line is a moving average that calculates closing prices as a percentage of the %k line.
- During an uptrend, if these lines cross from below and closing prices are near their lowest levels, this could mean the trend is reversing downwards (bearish reversal), suggesting it might be a good time to sell.
- During a downtrend, if the lines cross from above and closing prices are near their highest levels, this indicates a reversal upwards (bullish reversal), suggesting it might be a good time to buy.
3. Relative Strength Index (RSI)
The Relative Strength Index, or RSI, is a trading tool that shows numbers from 0 to 100. These numbers help indicate if the market is too high (overbought) or too low (oversold).
- An RSI value above 70 suggests the market is overbought, which often means prices might start to fall. This gives an offer to a trader to sell or place a short trade.
- An RSI value below 30 indicates the market is oversold, which often means prices might begin to rise. This can be a good chance to buy or place a long trade.
Trendlines used together with RSI offer clarity on the market’s direction during specific times, assisting traders in making informed forex trading decisions.
4. Trendline Breakout Strategy
The trendline breakout strategy helps traders find potential points where the market might change direction. In case a currency pair’s price crosses a trendline from either direction, it may indicate a market reversal.
- If a price breakout happens below a trendline in a downtrend, it suggests a possible upward turn in the market, prompting traders to buy or place long orders.
- Conversely, if a price breakout happens above a trendline in an uptrend, it suggests a potential downward shift, signaling traders to sell or place short orders.
A bullish reversal is confirmed when downtrend prices move across the trendline from below and start indicating an upward trend. In a similar manner, a bearish reversal is established when prices that were previously rising above the trendline begin to move downwards and suggest a reversal in the trend.
Similarly, a bearish reversal is established when prices that were previously rising above the trendline begin to move downwards and suggest a reversal in the trend.
Conclusion
Utilizing trendlines in forex trading helps pinpoint the optimal spots for executing successful trade orders. By analyzing market trends and integrating various indicators, you can effectively decide on short or long positions in the forex market.
Trendlines serve as a crucial instrument in forex trading, aiding in the identification of trends, support and resistance levels, as well as potential entry and exit points for trades. Nevertheless, accurately identifying significant swing highs and lows is vital when drawing trendlines to ensure accuracy and facilitate well-informed trading choices.